Tokenomics models you can audit line by line
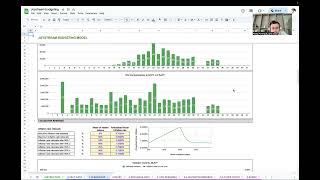
Working spreadsheets in Google Sheets and xlsx. Unit economics, token demand, token supply, market model, P&L, and dashboards — every number a formula, every input sourced and dated.
What we model
Six layers, all connected, every number a formula. Most tokenomics gets sold as a deck — static numbers in slides. We deliver a working spreadsheet you can audit cell by cell.
Unit economics
Per-user, per-validator, per-asset cost-revenue analysis. Cohorts, churn, LTV/CAC, breakeven points. The numbers that decide whether the protocol is viable at all.
Token demand
Ten different demand-side models — staking, payment, governance, burn, lock-up, discount tiers, access, lending collateral, subordination, redemption. We pick the ones that match the product and model them.
Token supply
Five supply models — linear emission, halving, bonding curves, allocation with vesting, mining rewards. Modeled against product milestones, not arbitrary calendar dates.
Market model
LP depth and AMM curves, sell-pressure projections per stakeholder, market-maker economics. Where price meets supply meets behavior.
P&L
Revenue streams, opex categories, treasury cashflows, runway calculator. The financial statement that lets your CFO defend the numbers to investors.
Management dashboards
KPI panels, scenario toggles, sensitivity tables, sanity-check signals. Built so the team can drive the model after we hand it over.
How we work
From a discovery call to a delivered model in five steps. Every step ends with a written artefact you can challenge.
Discovery
Stakeholder map, supply and demand sources, key questions for the team. End state: a written brief both sides agree on.
Mechanics modelling
Allocation, vesting, emission, sinks, sources — built into a working spreadsheet with cross-references and audit-friendly formulas.
Validation and report
Internal QA pass, written rationale per number, dashboard with KPIs. You get the model, the deck, and the reasoning behind each cell.
Inputs and assumptions
Every input parameter listed with source and snapshot date. No magic numbers, no unverified market data.
Scenarios and sensitivity
Base, bull, bear toggled by an input cell. Sensitivity tables across every parameter that moves the answer. Sanity checks built into the sheet.
Have a scope already?
Send the docs. We will come back with a price, a timeline, and a recommended modeling depth.
Sectors we model
Real mechanics from our 240+ patterns library, mapped to where each one shows up most often.
DeFi
GameFi
RWA
DePIN
L1/L2
Governance
Selected case studies
Engagements where the spreadsheet was the core of the work.
Perpetual DEX tokenomics
Full token model for a perp DEX: allocation, vesting, fee distribution, staking, treasury. A 15-table embedded model.
GameFi clicker economy
Tokenized revenue with a Uniswap v2 LP and layer-mining mechanics. Allocation, unit economics, scenarios.
Token economy design — recorded session
Walkthrough of a real modeling engagement: allocation, vesting, sinks, sensitivity. End-to-end on video.
FAQ
When do you need a tokenomics model?
How long does an engagement take?
What deliverables ship?
How is modeling different from simulation?
How is modeling different from an audit?
Do you sign NDAs?
Want a model you can actually audit?
Tell us what you are building. We will read the docs and come back with a focused proposal.